Chart.js
Chart.js is a community maintained open-source library that helps you easily visualize data using JavaScript. It supports 8 different chart types (including bars, lines, & pies), and they’re all responsive. In other words, you set up your chart once, and Chart.js will do the heavy-lifting for you and make sure that it’s always legible (for example by removing some uncritical details if the chart gets smaller).
to do to draw a chart with Chart.js:
- Define where on your page to draw the graph.
- Define what type of graph you want to draw.
- Supply Chart.js with data, labels, and other options.
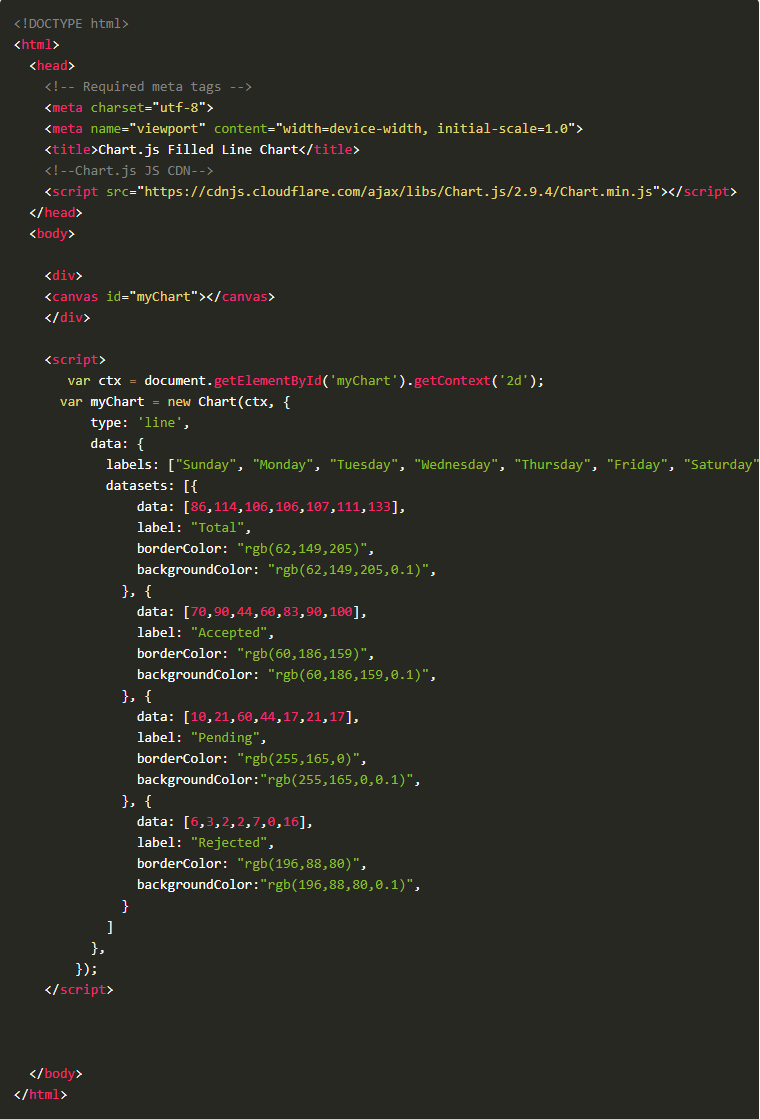
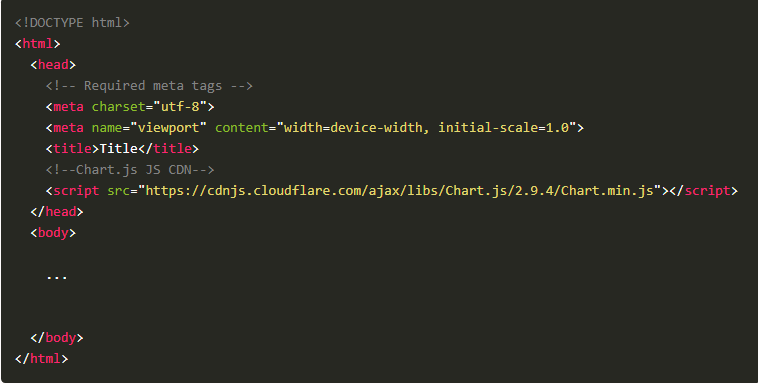
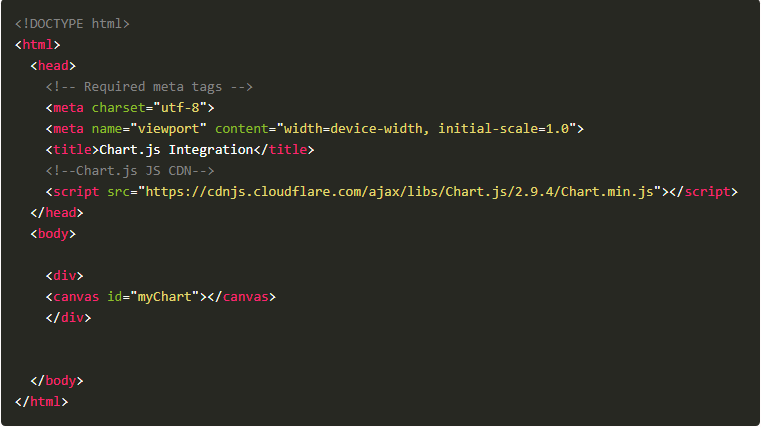
Step 1: Add Chart.js
Step 2: Prepare a place in your HTML to render the chart
## Step 3: Prepare the data